The Daltix Data Architecture Series
4 october 2022
Introducing the Daltix data architecture
Here at Daltix we do data, and lots of it: we scrape hundreds of websites – collecting, standardising and enriching 33.5M data records and over 100M data points every single day. We started the company with the idea that a lot of value was stored in the pricing data on webshops and online grocery retailers. It didn’t take us long to prove this, and more: we soon realised that product data – the name, weight, brand, etc. of a product – is also valuable. To get the value out of that data though, we needed to store it, transform it, and be able to analyse it; clearly the Microsoft Access database that our CEO started with (true story!) wasn’t going to cut it. Since then, Daltix has evolved and we’ve built what we think is a pretty solid data architecture.
We obviously know that data is important, but we also truly believe that transparency is crucial to creating a good team, product, and company.
That is why, in this series of blog posts, we want to share our data architecture with you. Maybe one of these posts can help you in your data journey, or perhaps inspire you to join ours?

What does Daltix do?
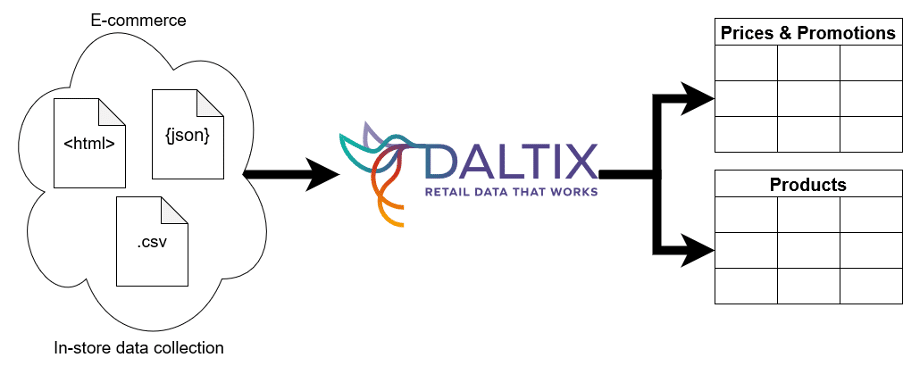
Before we dive into our data architecture though, it’ll be useful to give a quick overview of what it is we do. In a nutshell, we collect online retail pricing, product and promotion information, clean it and provide it in a structured fashion to our customers. The bulk of the data we download – our source data – is HTML pages and JSON API responses. We’ll take this data in, clean it, standardise it and enrich it to form a core of usable data. This data then supports our three main products. First, in the simplest one, the data is shipped to the customer directly to ingest in their own data infrastructure. From there our customers use their own analytical tools to come to insights that help drive business decisions and pricing strategies. Second, it also sits behind our web-based matching application where competitor’s products are matched to our customers’ own products. And finally, if needed, it is also used by our standard dashboards that provide some ready-made insights to our customers.
As you can see, data collection and transformation is a major cornerstore in what we do. Over the years we’ve built our data infrastructure to make sure we can keep processing the amounts of data that we need to, and ensure that we have the flexibility we need to accommodate new uses of the data that may be valuable to us or our customers. This scalability and flexibility have driven a lot of the decisions that have brought us to our current architecture, and which technologies sit in it.
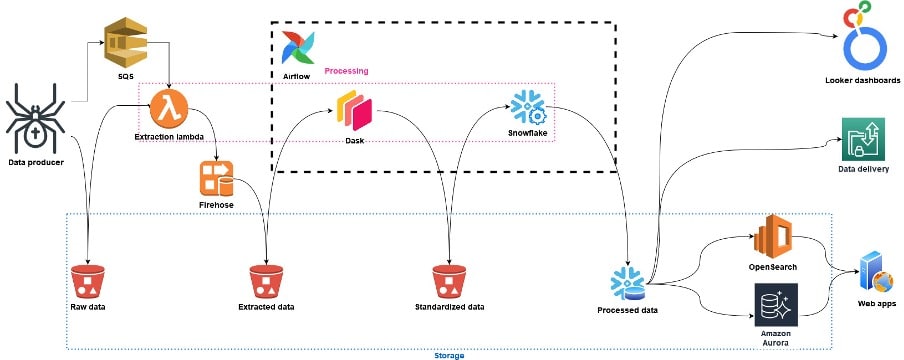
Our data architecture at a glance:

The image above shows our architecture in function of our data flows: from source data collection to customer delivery. We use AWS Lambda, Dask, and Snowflake for data processing and transformations, depending on the use case. Through these, the data gets transformed in stages, and each stage is stored separately: we use S3 for our early storage layers, Snowflake for the main repository for analysis-ready data, and OpenSearch and Amazon Aurora for quick-access storage.

This staged design, storing data in a certain format in distinct places, is a common pattern in data architectures (where a 3-stage design is sometimes referred to as a ‘medallion architecture’). To understand how the data moves through our systems in particular, it’s good to know which layers we have and why. Each of these layers will be discussed in more detail throughout this series, but in a nutshell we have:
- Raw data: this is where most of our data enters our systems. Data at this point consists of the raw HTML and JSON documents we’ve downloaded from the web.
- Extracted data: since HTML and JSON documents from different sources all have different structures, we extract the snippets we’re interested in and store them under standardised keys in this layer.
- Standardised data: data here is fully standardised: units are universal, promotions have been parsed into canonical forms, etc. Whereas the extracted data has standardised keys, here the values have also been standardised.
- Processed data: this is a rejigged version of the standardised data in a shape that allows for easy analytical processing. This is the first layer that’s made available in Snowflake, exactly because it is accessed for analytics.
- Amazon Aurora & OpenSearch: for applications where super-low latency is crucial (such as interactive dashboards), cuts of the same processed data are also made available in an Amazon Aurora database and OpenSearch.
Continuous improvements
Rome wasn’t built in a day, and our data architecture has evolved a lot over time. Especially since our early days as a start-up – even though it has only been 6 years, it seems like ages ago – when the focus was on moving fast to get to market quickly. Despite believing we have got the basics right in our current architecture, we expect it to evolve further as Daltix continues to scale. If all this sounds exciting to you, let us know. We’re always on the lookout for talented data engineers to join our team!
In the meantime, we’ll break down this architecture into its individual stages in the next few posts, and discuss why we chose the technologies we’ve gone with. Watch this space!
Want to read more? Here’s the next blog post: Data Extraction!
- Share this article
Related resources.

Daltix introduces it’s Data Quality Indicators to ensure data transparency
If your data provider doesn’t give you a clear outline of how they test their own data for quality, you should get suspicious. In order to deliver data you can trust, we’ve developed the Daltix Data Quality Indicators. Read about what our DQIs are and why it’s good for your data here!

Download the Daltix Summary & Data Span Matrix
As we are expanding across Europe, here is a downloadable matrix on what data and features Daltix offers as well as what countries we collect in and for what retailers.

Daltix Data Architecture: Data Access
In the final blog post of the data architecture series, we’ll take a look at how Daltix can provide everyone who requires their data access in a way that suits them. To answer that, we’ll examine our two data setups and explain our experiences and how they fit into our data architecture.