Daltix Data Architecture:
Data Standardisation and Shaping

18 October 2022

If you missed the two previous posts in the series, here are links to the first two:

To kick off the third post in our data architecture series, let’s consider again what the final goal is of this architecture; what it should achieve. We want to provide pricing and product data to our customers in a format that allows them to get the insights they want without having to worry about data preparation. In the last post we talked about how we extract relevant data from the raw files we download from the internet using AWS Lambda and Firehose. In this post we’ll discuss how we use Airflow, Dask, and Snowflake to standardise that data and reshape it to arrive at the dataset that underlies the products we offer our customers.

Standardisation

On the surface, it may seem that the kind of data we download doesn’t call for a lot of standardisation. After all, the data we have in the Extracted layer already has standardised keys, and all our prices are in the same currency. So let’s take a look at an example.

Lipton Yellow Label tea bag offer at two Belgian grocery stores - retailer A and retailer B.

Recently, there was an offer on Lipton Yellow Label tea bags at some Belgian grocery stores, and we took a screenshot of two retailers’ websites. On the left, retailer A offers a price of €0.45 per box if you buy at least 4. If we buy 4 boxes, that comes down to a 50% discount (roughly; €0.89/2 = €0.445). On the right, retailer B has a different offer: buy 2, get 2 for free. If we add 4 boxes to our shopping cart, that comes down to a 50% discount again ((2x€0.89)/(4x€0.89)=0.5). Both retailers have a very similar promotion running on this product, but that’s not immediately clear from the text in the images.

Converting offer text to a standardised representation is only one of the standardisation tasks we perform. Prices often need to be calculated per unit (one retailer might show the price per kg, while another might show it per 100g), and pack sizes need to be standardised. Though they’re all different, all these tasks have the same purpose: making sure that data from different sources is easily comparable.

With all the data processing frameworks available today, we had many options for how to implement this standardisation step, which in the end is just a massively parallel data processing job. We originally implemented it in a Spark setup, with all the jobs written in Scala (PySpark was at the time not yet as reliable as it is now, and the Spark Pandas API did not exist yet), but soon realised that finding senior Scala engineers to maintain this code was extremely hard. Over time, it became clear that we needed to align the tech we used more with the skills that we had available.

By far the largest part of our codebase was written in Python, and our data analysts had long used Pandas in their data explorations, so when we found Dask, it ticked a lot of boxes. If you’re unfamiliar with Dask, it may be best described as distributed Pandas, or a Spark-like framework with a Pandas API. (If you’re very familiar with Dask, forgive us the simplified explanation.) It is fully implemented in Python, and hence natively supports it, and works on the widely known Pandas APIs. Both were skills that we had ample experience with in the team, so we translated our logic over to Dask.

The Dask jobs read data from the Extracted layer on S3 and they run on EC2 instances. These are provisioned through AWS Batch, which takes away a lot of the scaling complexity. The jobs are triggered by Airflow on a scheduled basis as part of a DAG, which we’ll discuss a bit further down. Finally, output data is written to S3 again, into the Standardised layer, where it gets picked up to be transformed into its final shape.

Reshaping

When building a data warehouse, data gets transformed from its original format into a shape that’s easy to consume for data analysts (dimensional modelling being the most popular way of doing this). In much the same way, we mould our standardised data into a table structure that is easy for analysts (either at our side, or at our customers’ side) to consume. Up to the standardisation stage, the data basically consists of a loose collection of data points in JSONlines format. In the Processed layer it is presented as a groomed, well-defined and structured entity. The transformations in this step involve things like removing duplicates, aggregating data on a per-day level, creating last-month snapshots, etc. 

The data in the processed layer is stored on Snowflake. This lets our analysts access our data directly using SQL with great performance (we’ll discuss the pros and cons of Snowflake and S3 for storage in a later post). Apart from a data repository, Snowflake is also our ETL engine in this final step: standardised data is loaded through a Prefix stage, which loads data from S3 and automatically takes care of processing only new data. Once loaded, the data gets transformed into the necessary tables through transformations written entirely in Snowflake SQL. The ability to write this code in SQL made Snowflake very attractive because it’s such a widely known language, and its scaling capabilities sealed the deal (scaling is virtually instantaneous, and can also be done through SQL commands).

Orchestration

As we’ve briefly mentioned before, we use Airflow to orchestrate our transformation steps in this part of the architecture. We’ve set up a single DAG (Directed Acyclic Graph; Airflow’s term for a pipeline, or a workflow) that first kicks off the standardisation in Dask, and then the loading and processing into Snowflake. This DAG is scheduled to run every hour, processes any data that has appeared in the Extracted data layer since the last run, and ends when that data has been added to the final tables in Snowflake.

At this point, our data is in its final shape: clean, standardised, and ready to be consumed. Because there are a few different access patterns across the data consumers, we also have a few different ways of providing the data to them. We’ll discuss these last stages in our data architecture in the next post.

Want to read the next, and final, blog post about how we handle our data?  Here’s the link to Data Access!

Related resources.

News

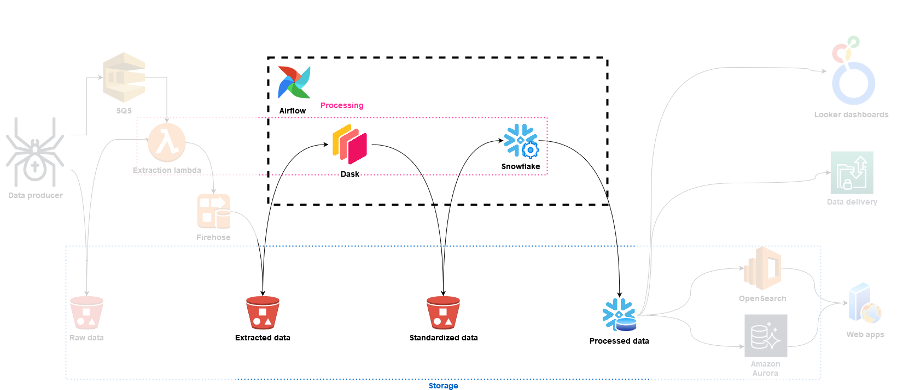
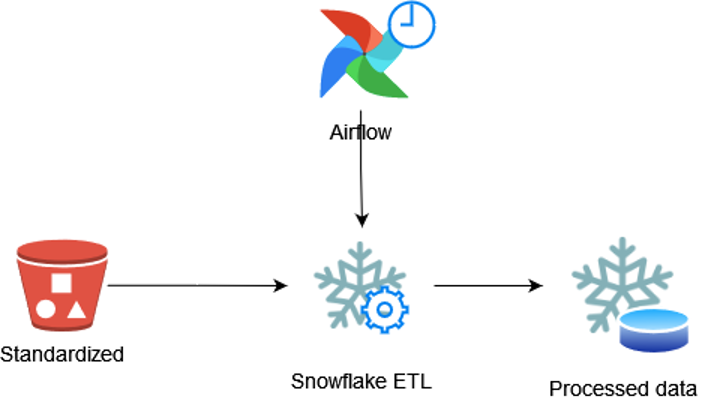
Daltix Data Architecture: Data Access

In the final blog post of the data architecture series, we’ll take a look at how Daltix can provide everyone who requires their data access in a way that suits them. To answer that, we’ll examine our two data setups and explain our experiences and how they fit into our data architecture.

Read article

This is what Daltix
stands for.

Integrity is our superpower.

We envision and build the future of data.

Collaboration is key.